1. Executive Summary
This report analyzes the market impact of the Bank of Japan's (BOJ) three rate hikes over the past two years (March 2024, July 2024, and January 2025). The data confirms that while the BOJ has been on a consistent path of normalization, market reactions have varied drastically.
- The "Liquidity Crisis" (July 2024): The rate hike in July 2024 triggered a massive unwinding of the Yen carry trade, causing a liquidity shock across global assets.
- The "Non-Events" (March 2024 & January 2025): Both the initial exit from negative rates and the subsequent hike in early 2025 were absorbed without systemic stress.
- December 2025 Outlook: The upcoming synchronized moves between the Fed and the BOJ signal a shift toward fiscal-oriented market drivers for 2026.
2. The BOJ Rate Hike Path & Fed Reactions (March 2024 – Present)
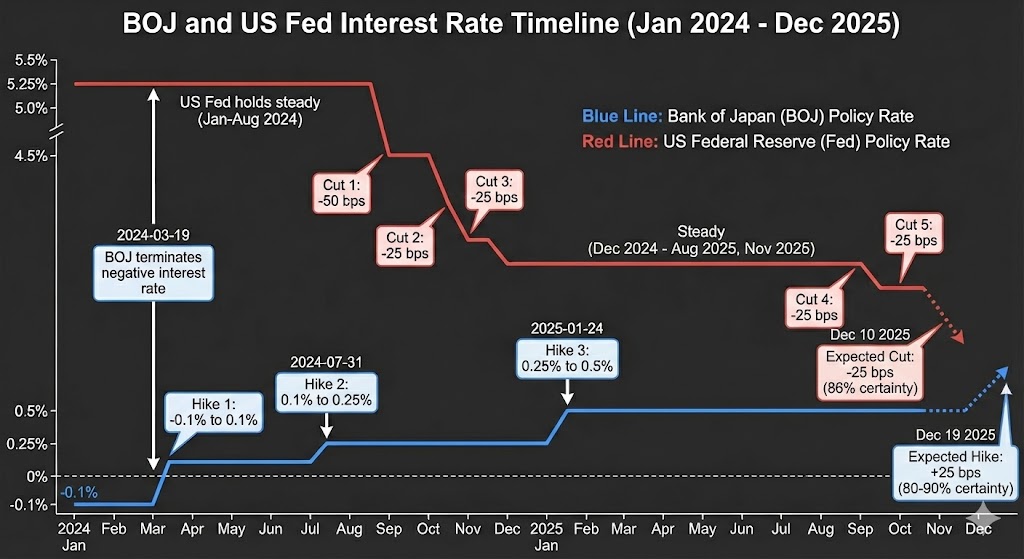
The BOJ has executed three key hikes while the US Federal Reserve maintained a divergent policy until late 2024.
-
Hike #1: March 19, 2024 (Policy Rate: -0.1% → +0.1%)
Context: Historic exit from negative interest rates.
Fed Stance: The Fed held rates steady (5.25%–5.50%), maintaining a wide interest rate differential. -
Hike #2: July 31, 2024 (Policy Rate: 0.1% → +0.25%)
Context: The second hike, combined with quantitative tightening (QT) signals.
Fed Stance: The Fed held rates steady during their July meeting and effectively went on a "summer break" (with no scheduled meeting in August), leaving them blind to the unfolding chaos. Caught off guard by the severity of the liquidity crisis, the Fed was forced into a reactive and somewhat embarrassing pivot: they executed an aggressive "emergency" 50 bps rate cut in September, followed by two additional cuts in the subsequent meetings, effectively chasing the market to repair the damage. -
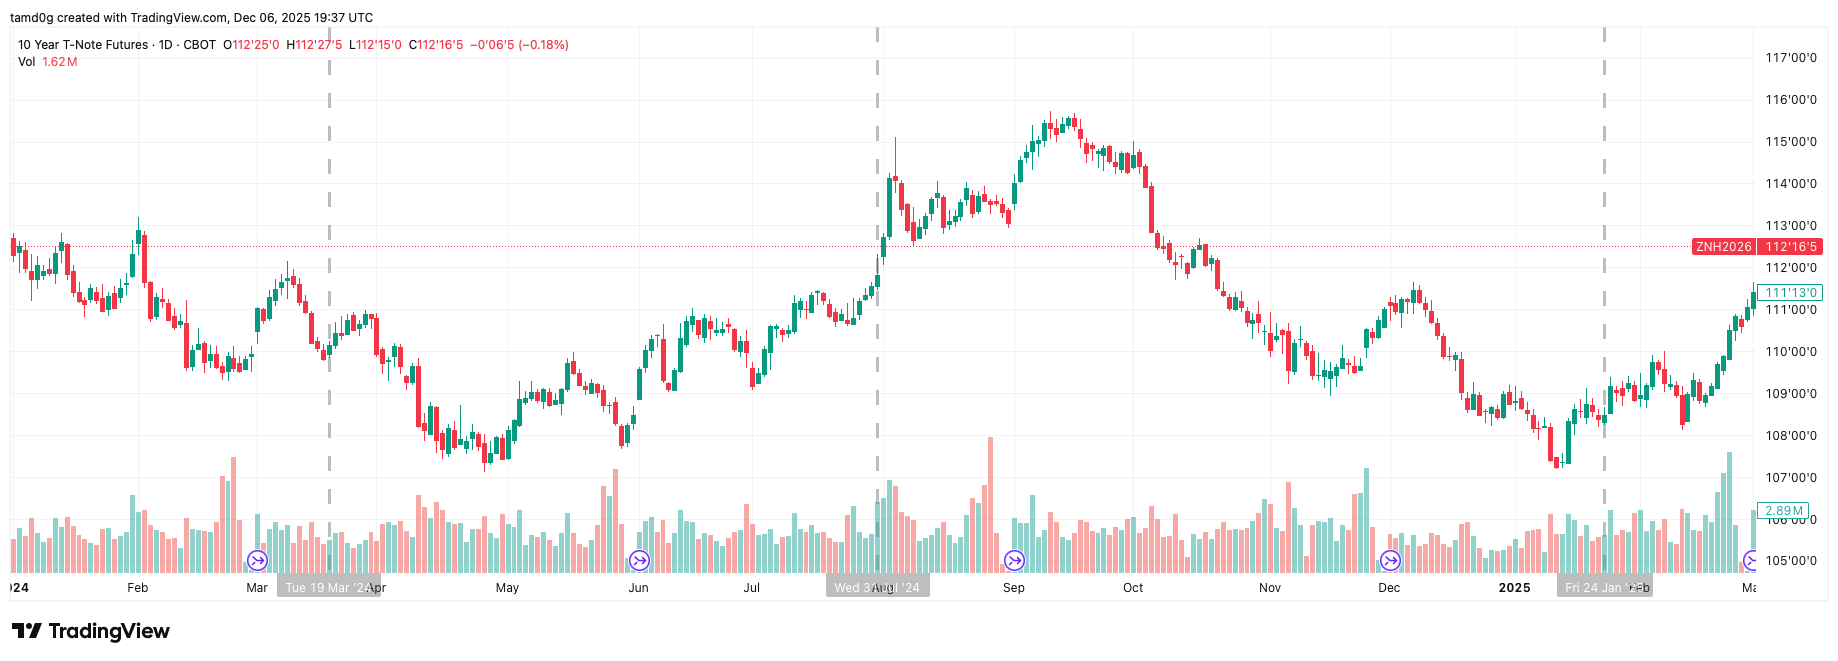
Hike #3: January 24, 2025 (Policy Rate: 0.25% → +0.5%)
Context: Continued normalization.
Fed Stance: By this time, the Fed had initiated cuts (Sep/Nov/Dec 2024), narrowing the spread, yet the market remained stable.
3. Market Reaction Analysis by Asset Class
Hike #1: March 19, 2024 (The "Sell the News" Event)
- USD/JPY: Ironically, the Yen weakened (USD/JPY rose) after this hike. The move was so well-telegraphed that markets treated it as a "dovish hike," and the rate gap with the US remained too wide to force capital repatriation.
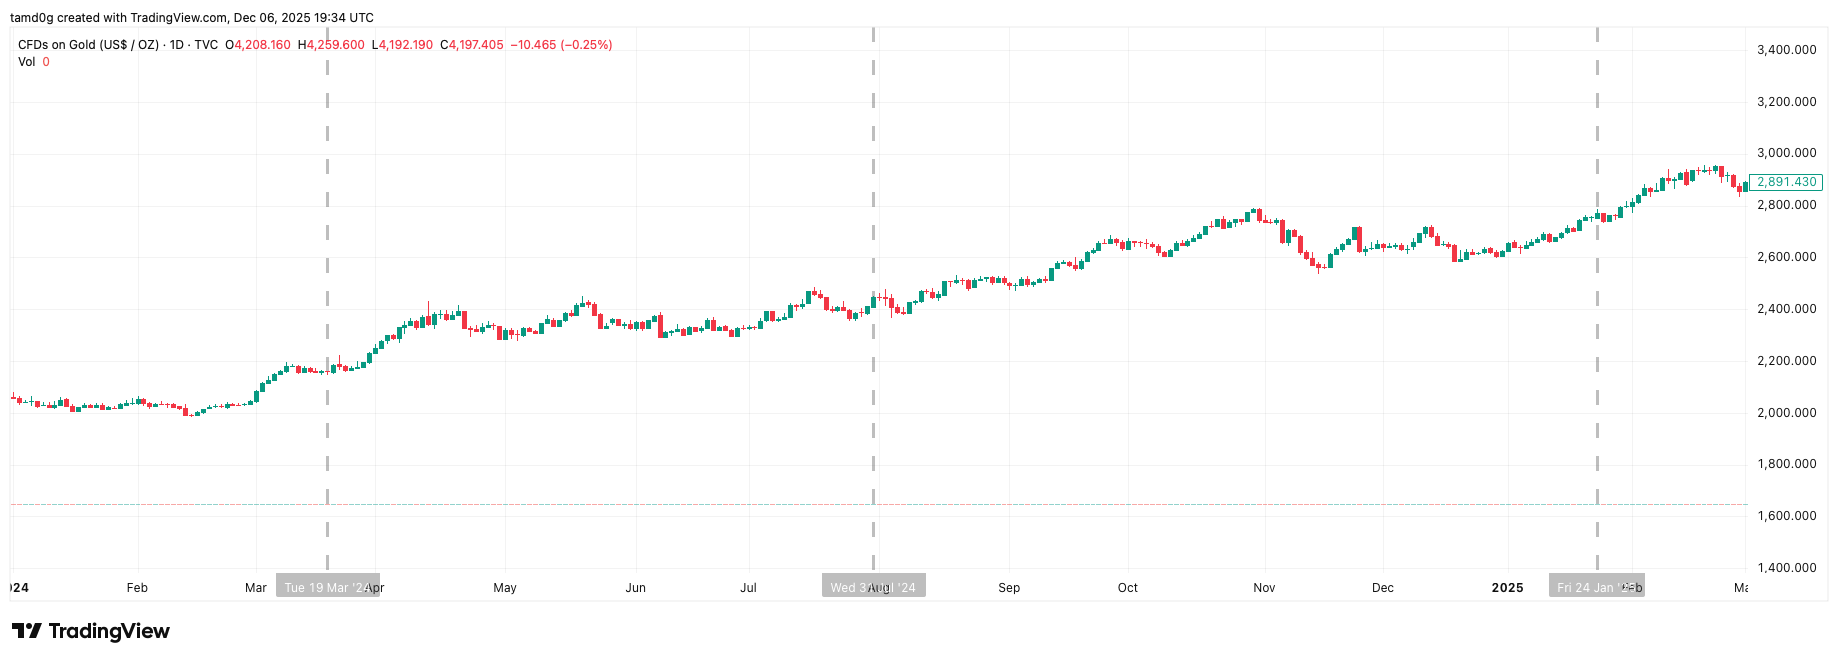
- SPX & Gold: Both assets continued their uptrends unimpeded.
- Verdict: No Liquidity Issue.
Hike #2: July 31, 2024 (The Liquidity Crisis)
This event stands out as the single point of failure in global liquidity during the cycle.
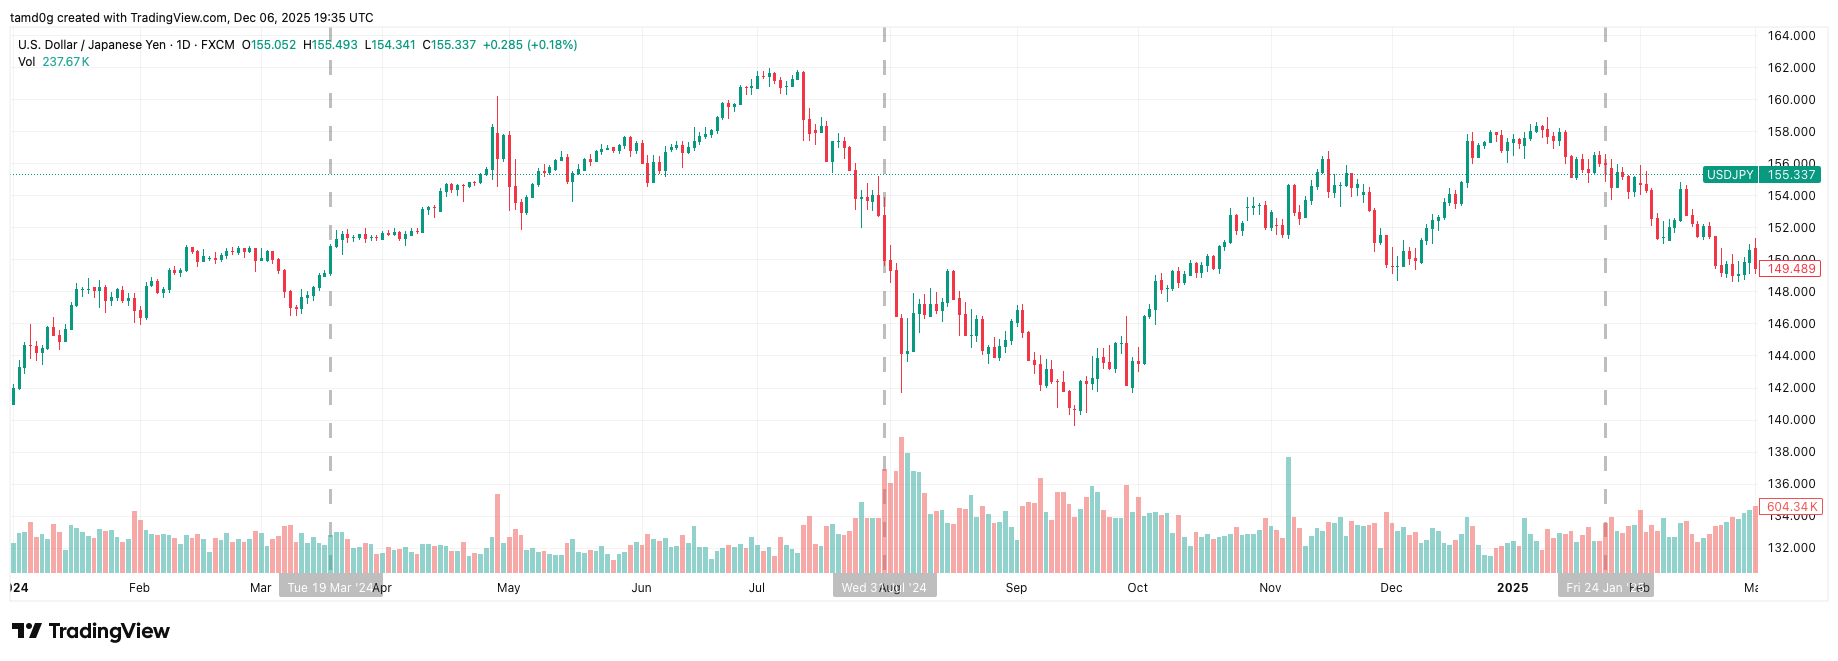
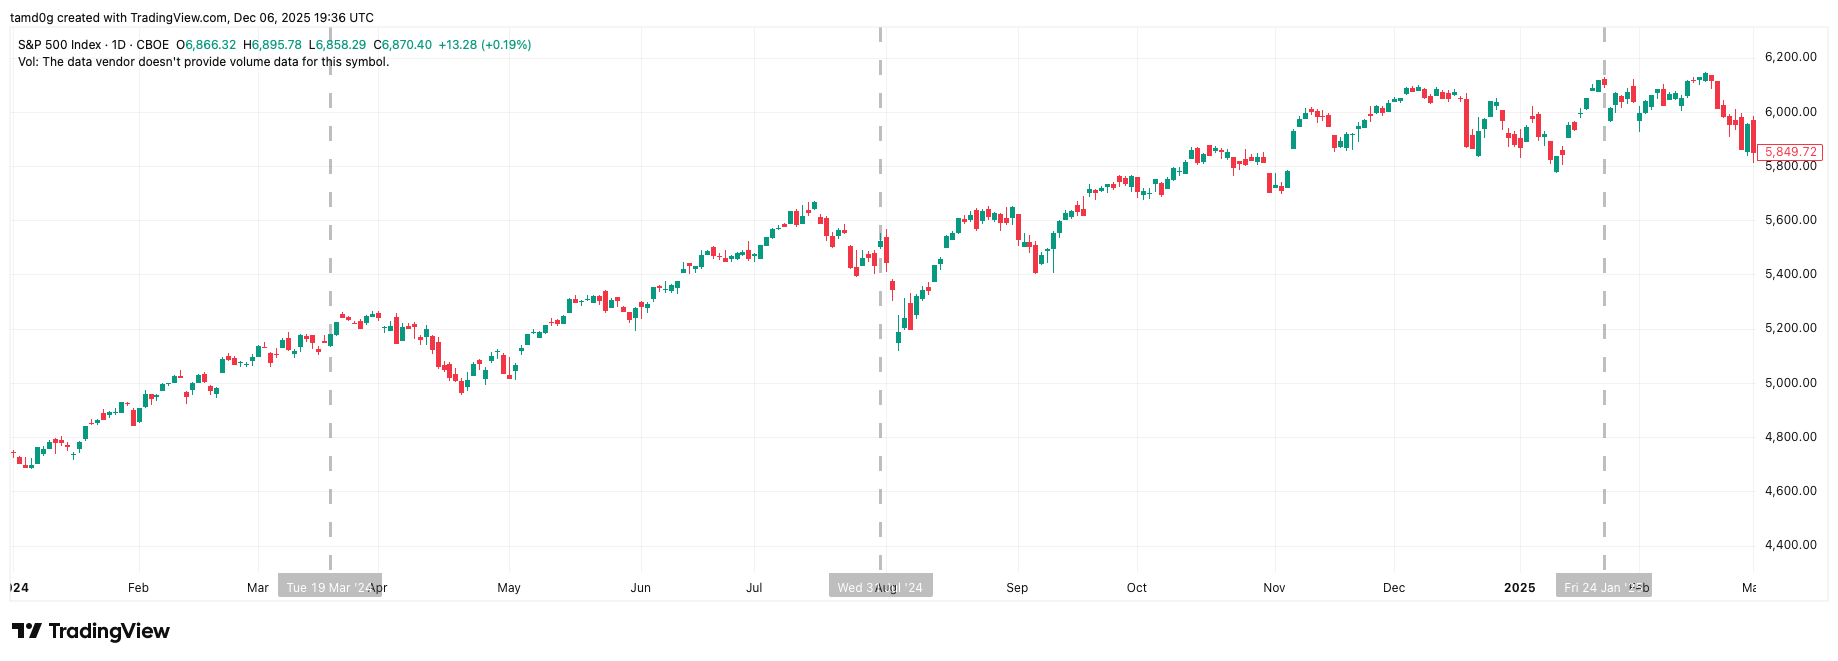
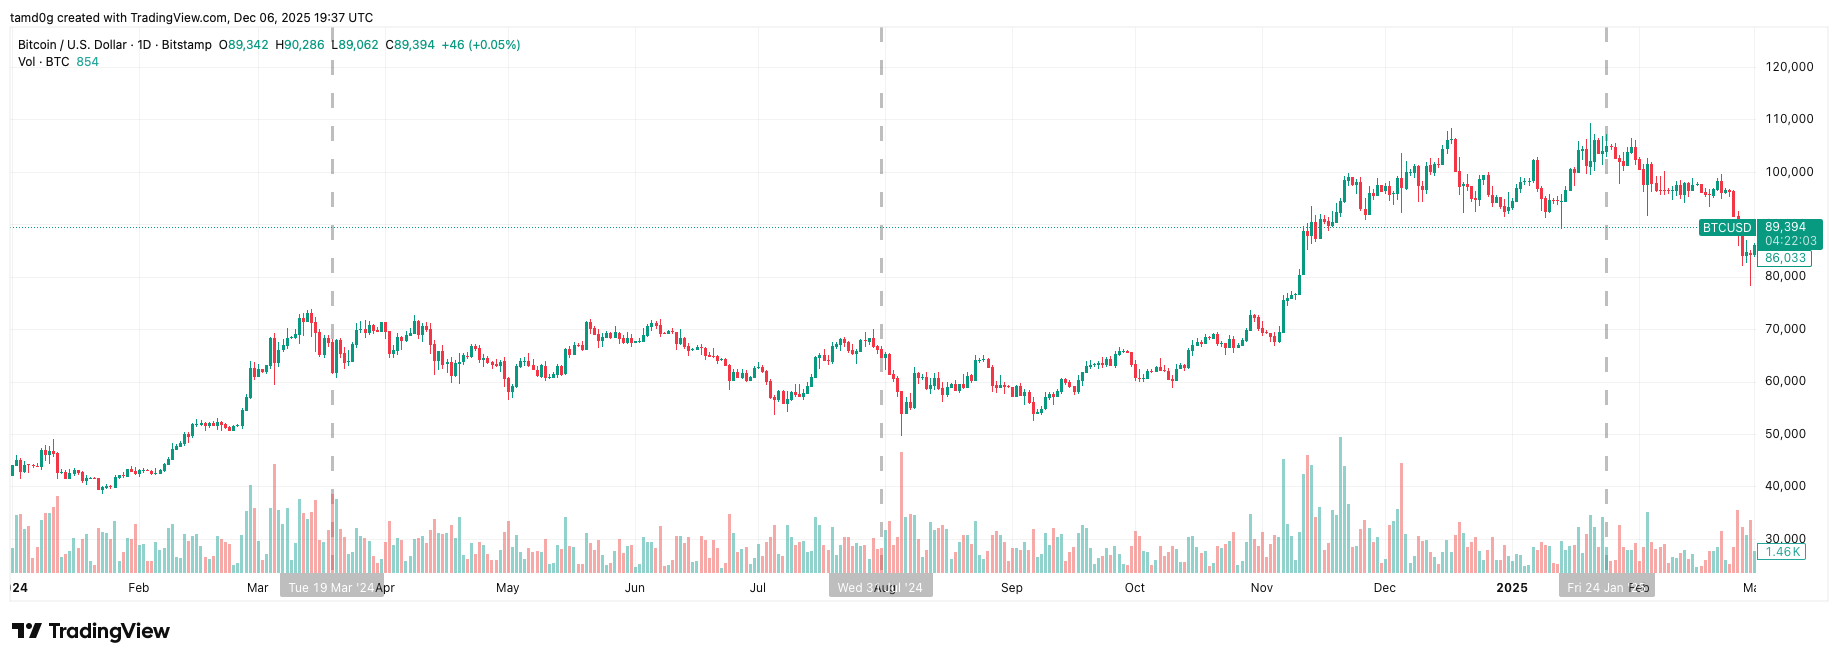
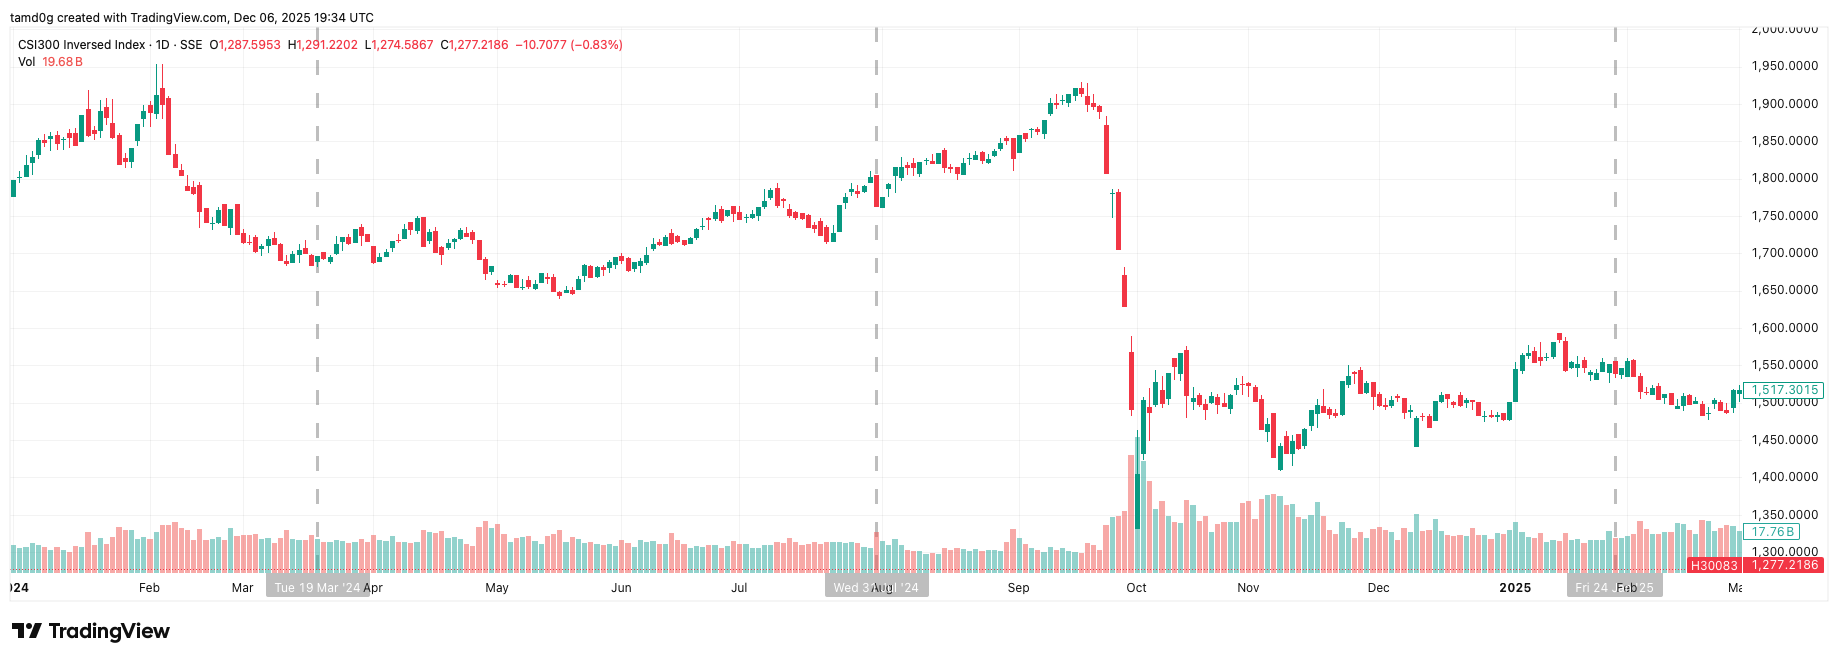
Verdict: Confirmed Liquidity Crisis. The simultaneous collapse in USD/JPY and risk assets confirms that the tightening drained global liquidity too fast for the system to handle.
Hike #3: January 24, 2025 (The Normalized Hike)
- USD/JPY: The chart shows a stable, range-bound reaction. By Jan 2025, the "hot money" had already left the carry trade, leaving only long-term institutional capital.
- SPX & Gold: Both assets resumed their uptrends leading into and out of January 2025.
- Verdict: No Liquidity Issue. The market had successfully adjusted to the "new normal" of positive Japanese rates.
4. Forward Outlook: The December 2025 "Coordinated" Move
As we approach the end of 2025, the timeline suggests a highly choreographed sequence of events:
- December 10, 2025: Fed Cuts rates (Expected -25 bps).
- December 19, 2025: BOJ Hikes rates (Expected +25 bps).
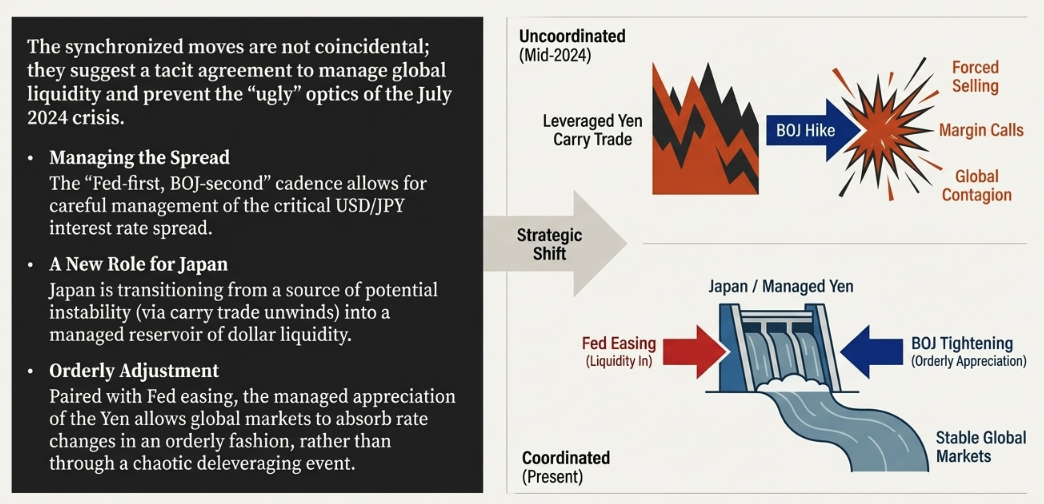
Why This Will Be Uneventful
Unlike July 2024, this divergence is happening with the Fed easing. In July, the BOJ hiked while the Fed was effectively "tight" (holding high rates). In December 2025, the Fed is providing liquidity (via cuts) exactly as the BOJ removes it. This "liquidity hand-off" prevents the vacuum that caused the July crash.
The Political & Fiscal Dimension (2026 Prediction)
A deeper look at the leadership dynamics suggests this is not just monetary policy, but fiscal coordination:
- The "Survivors": Both BOJ Governor Ueda and Fed Chair Powell have retained their positions longer than the political administrations in their respective countries (implied by recent US/Japan leadership changes).
- Fiscal Dominance: The fact that central banks are timing their moves so precisely—offsetting a hike in Tokyo with a cut in Washington—suggests that monetary policy is being subservient to fiscal stability. They are working together to curb volatility and protect steady market growth.
Conclusion:
If the December rate decisions proceed as expected, the synchronization between the BOJ and Fed
suggests that these will likely be uneventful events. However, moving forward to 2026, market
reaction will be redirected from monetary policy to fiscal policy. This shift is expected to boost
the prices for all assets priced in dollars.